


 Spanish (pdf)
 Article in xml format
 Article references
 Send this article by e-mail
 Cited by SciELO
  Similars in
SciELO
Similars in
SciELO 
 Permalink
INTRODUCTION
Advanced Information Technologies (IT) have the capability of developing complex, robust and interoperable healthcare IS. One of the most challenging areas of healthcare is Oncology. The reason of this is that cancer incidence and mortality rate remain very high. According to the World Health Organization (WHO), cancer is one of the leading causes of morbidity and mortality worldwide and was responsible for 9.6 million deaths in 2018 1. Globally, nearly 1 in 6 deaths is due to cancer. The mortality rate is even higher in low- and middle-income countries.
Additionally, the knowledge of this domain is changing very quickly because of cancer’s complex nature. Continuously new clinical, biological and genomic data become publicly available which may improve the diagnosis and treatment of the patient. These different kinds of data have diverse data sources, formats and management strategies, what hampers their interoperability and semantic integration. Conceptually speaking, it is essential to save and manage them in an integrated environment, which will allow clinicians to enhance the decision-making process. From this point of view, to model and develop complex IS to meet these challenges is strictly required. The accurate and proper implementation of such a sound, well-designed, conceptual model-based IS could dramatically improve the quality of the services provided by medical centers.
The IS which is described in this work will be used as an Electronic Health Record (EHR). An EHR is a digital version of a patient’s paper chart. EHRs are real-time, patient-centered records that make information available instantly and securely to an authorized user 2. It contains retrospective, concurrent, and prospective information about the patient and its primary purpose is to support efficient, continuous and integrated health care.
The design of each part of the proposed IS has been based on the CM designed especially for this project where the concepts related to the domain of diagnosis and treatment of cancer (clinical, biological and genomic concepts) have been properly represented and related to each other. This CM is the result of iterative meetings and discussions with clinicians who are using the system within a pilot project 3. It is also an abstract and concise representation of data requirements carried out during the meetings, including detailed descriptions about types of entities, relationships, and constraints.
We have used archetypes to make the IS intuitive and easy to use. These archetypes are based on international standards - ISO-13606 4 - and have been used to create the User Interface (UI) of the IS. The archetypes have been traditionally used to structure information following users’ criteria and to create semantically interoperable systems 5 but it also can be used to create convenient UIs and make the system intuitive for doctors. This paper illustrates the way how to use the conceptual models and archetypes to develop easy-to-use IS for clinicians.
This paper is structured as follows: in Section 2 the current situation is stated. It shows the procedures used nowadays to manage the information in diagnosis and treatment of cancer’s domain and how it can be improved by using the proposed IS. Section 3 describes the CM designed and used as a background for this IS. Section 4 describes the software development process by using archetypes to create well-defined user interfaces and Section 5 explains the current situation of the IS implementation and the functionalities that will be included into the IS at the end of the project. Finally, Section 6 concludes the work and shows further work to be done in the future.
STATE OF THE ART
Currently many tools are available to manage and analyze the information of healthcare domain in general. As examples of those IS could be Orion Clinic 6, OpenEMR 7 and Institutional Registry of Tumors of Argentina - RITA 8. Orion Clinic is an IS for the management of clinical data created for the Valencia Health Agency 9. Orion Clinic offers users to input information by using free text fields which complicates the interpretation of the information during the exchange of data with another IS. On the other hand, OpenEMR is a free and open source electronic health records and medical practice management application. Although the implementation of the open source IS could be economically effective, it is very difficult to adapt these kinds of IS to cancer’s domain because they are not specialized to solve specific data management problems. A similar tool, like the proposed system, is installed and is being used in Argentina -RITA- to register cancer incidences. While this system can be used as a register, the system presented in this paper goes further: it integrates different kinds of data based on the CM and is used as an EHR which allows the clinician to access patients’ data in the Oncology department quickly and facilitates the daily work of the hospitals’ professional staff. As a conclusion, despite the existence of those large amount of ISs it could hardly be found specialized ISs for hospitals’ oncology department.
On the one hand tools available in the market mainly contain free text fields. In these fields, clinicians can write their diagnosis and procedures, in the same way they do it in a traditional paper-based health report. This makes very difficult to extract specific data from them due to the complex procedures of data extraction from text and even more difficult to analyze it to obtain statistical results.
On the other hand, these tools used to be designed specifically to manage only clinical or genomic data. To diagnose or treat properly such complex diseases as cancer, clinicians need to handle both types of data jointly to make the best decision, therefore it is necessary to manage this information in the same information system to facilitate these procedures and to improve patients’ care.
The proposed IS allows clinicians to store, manage and analyze data in an easier and faster way by offering the user a very efficient and functional environment for genomic and clinical data integration, management and analysis.
This IS aims at solving data management and analysis in the clinical oncology units of two hospitals of Asunción, Paraguay: i) Hospital de Clínicas 10, and ii) Instituto Nacional del Cancer (INCAN) 11. Currently, these two hospitals use paper-based records and *.xlsx (or *.csv) files to do the analysis they need for their annual statistical reports and research studies.
The oncology department of the Hospital de Clínicas was founded in January 2011, and since then every year the number of the patients is increasing. In 2016, 264 patients were registered in the department. The oncology department of INCAN started working from 1982 and approximately 300 breast and 200 colon cancers’ new cases are diagnosed every year.
The implementation of this IS based on CM will guide therapeutic strategy: will increase the effectiveness of the diagnosis and treatment of the patients and will significantly improve oncologists’ daily work. The final model was finished in June 2018. After the implementation of the system a survey was performed by 20 clinicians from Paraguay who participated in the development process of the platform to evaluate the level of satisfaction based on usability, flexibility and design of the system. Results of this survey showed a high level of satisfaction: 8 out of 10 on average 12.
THE CONCEPTUAL SCHEMA OF THE CLINICAL DATA
Clinical data, which is either collected during the course of ongoing patient care or as part of a formal clinical trial program, is recognized to be the key asset for most health and medical IS. Cancer’s complex and rapidly changing domain requires using advanced IS to ensure optimal clinical data management.
In this paper, the conceptual schema is divided into five views to ease the explanation. Using Unified Modeling Language (UML) 13 Class Diagrams, the proposed model describes classes, defines constraints and relationships between classes. Moreover, it shows a sophisticated way to integrate clinical and genomic data. This model is based on the “Conceptual Model of Breast Cancer” 14, which has been adapted and extended to represent the information handled during diagnosis and treatment of not only breast cancer but any kind of cancer.
Patient view
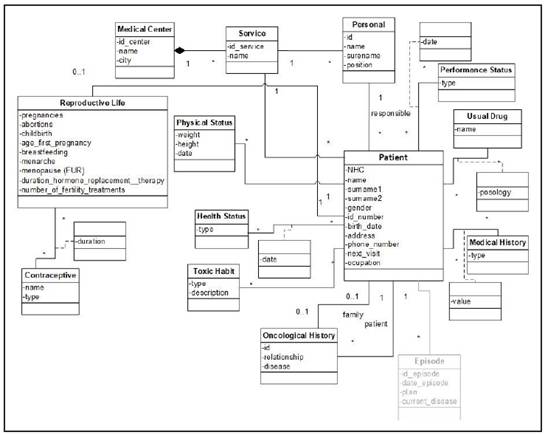
The Patient view (Figure 1) encompasses demographic and general information about the patient. The relationship with the “Episode” class shows that the patient can have many episodes. This class is shown with gray color as its view is explained separately.
The “Patient” class is the central class of the Patient view. It contains information about the person who arrives at the hospital with suspicions of suffering from the disease. The patient can come from a certain medical center. For this purpose, the “Service” and the “Medical Center” classes have been created. The “Service” class represents medical services that are parts of a medical center. The “Personal” class represents all clinicians or physicians who may be responsible for a patient.
In case the patient is a woman, upon arrival at the center, she will have a unique reproductive history, represented by the “Reproductive Life” class. The reproductive history of a patient is associated with the “Contraceptive” class representing the contraceptive treatments that the patient has used during her reproductive life.
Each patient may or may not have had a family member who has had some type of cancer. This is represented by the “Oncological History” class. It has two relationships with the “Patient” class. Those relationships show if the patient has had cancer before and if the patient has relatives who have had cancer.
The “Medical History” class represents all those diseases that the patient may have suffered before the first visit to the hospital. The “Habitual Drug” class represents those drugs that the patient takes frequently for various reasons. In addition, the “Toxic Habit” class represents the different habits or addictions that the patient could have, such as smoking.
The “Health Status” class represents the health status of the patient. This class is used to show whether the patient’s condition has changed. Like the “Health Status” class, the “Performance Status” class represents the state of the patient’s daily life.
Finally, the “Physical Status” class is used to register and monitor the patient’s weight and height.
Episode view
The Episode view (Figure 2) encompasses all services provided to a patient with a medical problem within a specific period of time. This view shows the relationship between the “Episode”, “Test”, “Sample”, “Treatment”, “Metastasis” classes, representing the different events that may occur in that episode.
The “Episode” class represents the concepts related to the events taking place in the patient’s medical history. In this model, we have specified 5 types of episodes.
• Emergency. This class represents those events in which the patient arrives at the hospital. In addition, this class has two subclasses indicating whether the patient is hospitalized - “Hospitalization” class - or is sent back to home - “Discharge” class.
• Monitoring. This class represents those events in which the patient comes to the hospital to continue the medical follow-up.
• Diagnosis. This class represents the event in which the patient comes to the hospital for the first time and starts a diagnosis process of the disease. In this event clinical, laboratory, pathological and complementary testing results are registered for a final diagnosis and for a plan of treatment.
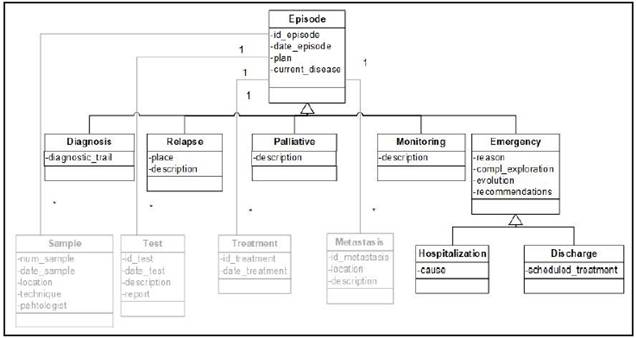
• Relapse. This class represents the event in which the patient arrives at the hospital due to a relapse of the disease.
• Palliative. The Palliative class represents the last phase of the disease. In palliative episode the patient receives palliative treatments to decrease all symptoms - physical, physiological, sociological - that could affect the quality of his/her life, by working not only with the patient but also with the family.
Test view
The Test view (Figure 3) represents the special methods done by doctors to detect and diagnose the disease. It is composed of the "Test" class and its subclasses. In this view the “Genetics” class makes it possible to integrate clinical and genomic data.
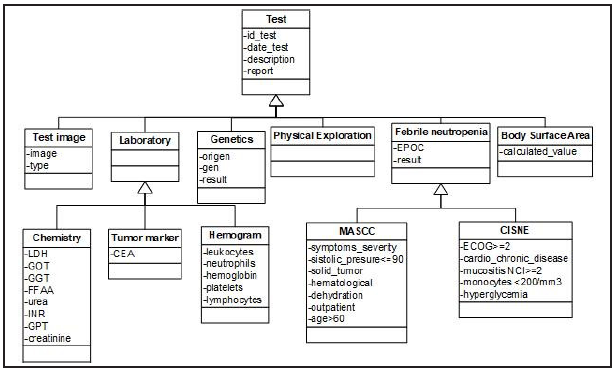
In Test view the “Test” class represents the different tests that can be done to a patient during an episode to diagnose if the patient has cancer or not. Test class is specialized in 6 subclasses:
• Test Image. It represents images of the patient´s body obtained by radiological tools.
• Physical Exploration. It represents the physical explorations performed by the physician.
• Laboratory. It represents those tests that are carried out in a clinical laboratory from samples of the patient. This class is subdivided into “Tumor marker”, “Chemistry” and “Hemogram” subclasses to indicate different type of tools that are used in laboratories.
• Genetics. This class represents a genetic test done in a molecular biology laboratory. It indicates if the gen of the patient has any variations.
• Body Surface Area. This class represents a formula that uses the weight of the patient and the value of creatinine to calculate the dose of different drugs. One of these most used drugs based on the results of this formula is carboplatin 15.
• Febrile Neutropenia. This class is subdivided into MASCC 16 and CISNE 17 subclasses, both of them are used by doctors to calculate febrile neutropenia risk in order to know if the patient should be hospitalized.
Treatment view
The Treatment view (Figure 4) encompasses the possible treatments that the patient can have. It includes the “Treatment” class and its subclasses. These subclasses represent special types of treatments that the patient receives depending on the type of cancer and how advanced it is.
During an episode a patient can receive several treatments. These treatments are represented by the “Treatment” class. In the model, we have 4 types of treatments:
• Surgery. This class represents those interventions that the patient undergoes to remove a tissue.
• Radiotherapy. It represents those treatments in which the patient is subjected to radiation to eliminate malignant cells.
• Exclusive Symptomatic. It is applied in the final stage to calm the symptoms. This treatment is mainly used in Palliative episode.
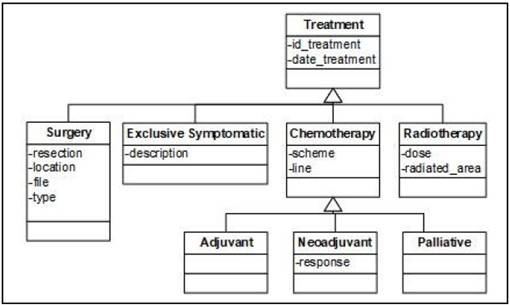
• Chemotherapy. It represents treatments that are based on cytostatic drugs. The “Chemotherapy” class has 3 subclasses. The “Adjuvant” and the “Neoadjuvant” classes represent those treatments that the patient takes after and before the main treatment respectively. The “Palliative” class represents the chemotherapy designed for metastatic cancer patients to prolong survival and ease symptoms but not cure the disease.
Sample view
The Sample view (Figure 5) represents a small amount of tissue removed from a patient to diagnose the disease and includes the “Sample” class and its subclasses. It also shows the relationship between the “Sample” and the “Metastasis” classes. The “Sample” class represents biological samples extracted from a patient. This class has 3 subclasses:
• Tumor. It represents the piece of cancerous tissue extracted from a patient. The relationship between the “Tumor” and “Lymph nodes” classes represents those lymph nodes that have been affected by the tumor. In addition, the relationship “is_primary_tumor” with the “Metastasis” class indicates the metastasis produced by that tumor in the patient. The relationship “is metastasis” indicates whether the tumor sample belongs to a metastasis. This class also relates to itself by the relation “evaluation tumor” representing the evolution of the tumor.
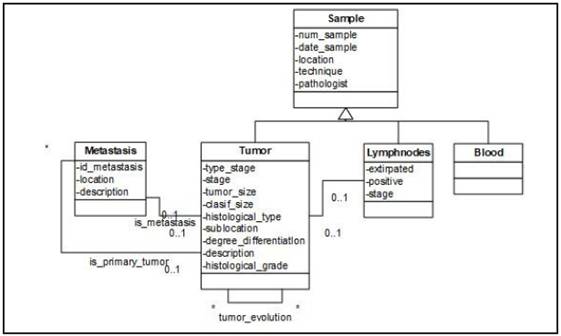
• Lymph nodes. This class represents the sample that contains the lymph node extracted from the patient to observe if they have been affected by tumor cells.
• Blood. Represents blood samples taken from the patient.
The “Metastasis” class represents the possible metastases that have been developed in a patient. These metastases may be diagnosed by radiological tests, and also have their origin in a tumor sample of the patient, which is represented by the relationship “is_primary_tumor” with the “Tumor” class.
DESIGN AND DEVELOPMENT OF THE APPLICATION
The design and the development of the application are based on emphasizing the efficiency, usability, and security aspects. A Web-based approach is the selected strategy to design the application as it has some well-reported advantages for the considered working domain 18.
Web-based software gives the user flexible access to the all necessary tools or required data. The user can get the information by using computers, notebooks, tablets and even compatible smart phones.
Data security 19 is one of the most important concepts of any kind of IS. When web-based software is used, data is stored in secure, always-updated, frequently backed-up servers in highly-secure data centers. Probably, the only disadvantage of those kinds of application is the network dependency since the user may feel troubled when the internet fails, or when the network does not work properly.
Web-based applications perfectly fit with Model-View-Controller (MVC) design pattern 20 which is used to create this application. MVC paradigm gives us a set of tools to implement the model during the development process (Figure 6).
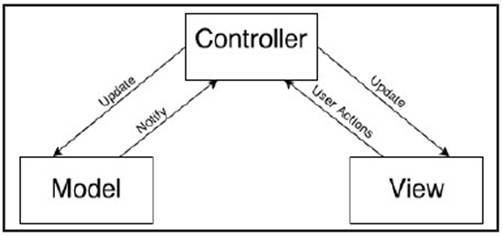
MVC consists of three kinds of object. The Model is the application object, the View is its screen presentation, and the Controller defines the way the user interface reacts to user input. MVC decouples them to increase flexibility and reuse 21.
a) Model. The model represents the object or objects that make up the underlying problem domain. In this application, the objects of the Model are created based on the Conceptual Schema which is described above.
b) Controller. The Controller receives commands from the user -User Action- and updates the Model and the View according to the commands. The Controller may receive notifications from the Model as well, indicating whether the updates are done correctly. The default controllers handle input from a keyboard and from a mouse.
c) View. The View is the visual presentation of the information contained in the Model. This usually consists of screens containing information from the model. As the MVC design pattern decouples the Model and the View, we can make different views based on the same data. This can be very useful and handy if we have different types of users. E.g. in the hospital we can have two types of users. The first one may only be allowed to read the information whereas the second one can make some updates, create a new episode and assign a treatment to a patient, even create new patient in the application.
Abstraction and automation are very important concepts of software development process. The model of a software application is defined on a higher abstraction level and this model is converted into a working application using automated transformation or interpretation 22. On the other hand, when high abstraction is used, one can specify less and guarantee more. This means that automatically generated graphical User Interfaces (UIs) 23 are less flexible and they may all look like each other. For this reason, MVC’s Model component are generated automatically by using Code Generator but the View and Controller components are programmed by hand based on archetypes to make the interface intuitive and easy for clinicians.
Several technologies were used in the development process of the web-based system. Among these technologies we can highlight, Java 24 using Eclipse 25 Integrated Development Environment (IDE), Vaadin Framework 26 and MySQL Relational Database Management System (RDBMS) 27.
Eclipse IDE provides Model to Text (M2T) transformation 28. M2T focuses on the generation of textual artefacts from models-in this context the conceptual model in UML diagram- for automatic code generation. Later on, this code becomes the Model component of the MVC design pattern. In order to make the interface flexible and intuitive, the View Component is developed separately by implementing archetypes.
In general, archetypes are used to create the conceptual layer of the EHR and enable information systems to guide and validate user input during the creation and modification of information. Archetypes are also used to guarantee interoperability at the knowledge level, not just the data structure level 29. But, interestingly, these archetypes can also provide well-defined UIs.
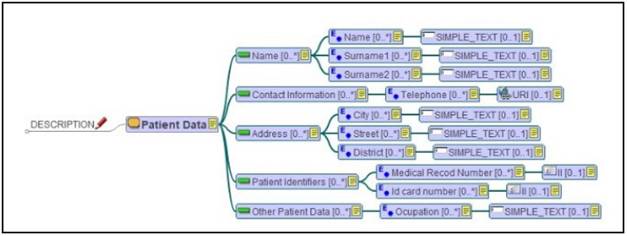
In order to design the interface of the application, some archetypes have been created based on the CM. In this way, the archetypes represent different views offered to the users. The simultaneous use of CM and archetypes facilitates a proper design implementation and a structured visualization of the information, making the application more efficient and easier to use. Additionally, the IS becomes semantically interoperable as the archetypes are based on ISO-13606 standards. LinkEHR 30 platform has been used to create archetypes (one of which is presented in Figure 7). It is a platform for the integration, normalization and semantic interoperability of clinical data.
In this archetype, the Patient Data represents a Section, with 5 Entries: Name, Contact Information, Address, Patient Identifiers, and Other Patient Data.
Each Entry has fields to represent specific information about the patient. This archetype has been used as a basis to implement the Patient Data section in the application. This approach ensures the optimal design of the application based on the CM, which is the basis for all the components of this IS (Figure 8).
There are 3 panels on the left sidebar of the application. The first panel shows the basic demographic information about the patient: “name”, “surnames”, “age”, etc. This panel is defined by “Patient Data Archetype” (Figure 7). The second one represents the EHR in tree form which clinicians can use to access all stored information about the patient. Finally, the third panel allows the clinician to assign a date to a patient for the next visit.
On the right sidebar, we have associated information about the patient life -Usual Drugs, Health Status, Oncological History etc. - with a short description. The patient’s episodes are presented in the middle of the application. These episodes also contain information about Treatments, Tests, and Samples. Lastly, if the patient is a woman, the Reproductive history is also shown.
CURRENT STATE
Currently, the application is installed in two hospitals of Asunción: Hospital de Clínicas and Instituto Nacional del Cancer. In Hospital de Clínicas the server is installed in a secure data center and is connected to the hospital private local network whereas in INCAN the local network is not ready yet hence the application can only be used in the Oncology department.
After the installation, the application undergoes testing. In this stage, the IS is being checked for errors, bugs and network issues. For this purpose, in both hospitals, clinicians use the program to attend the patients. In this stage, only the Oncology departments can use the IS.
In Hospital de Clínicas there are different entry units for Oncological patients such as Emergencies, Gynecology, Urology, Traumatology, Surgery and Oncology. After the testing, those departments will be allowed to access the IS through the local network. In INCAN it is planned to make the application accessible from Admission, Surgery, Pathology and Oncology departments. Different user types will be assigned for clinicians in different departments to update or add new information. E.g. the user in Admission can see or change the demographic information of the patient whereas the oncologist in the Oncology department can also make reports and will have whole access to the IS.
For this stage, a survey was prepared in order to evaluate the advantages and disadvantages of the system and prepare it for future improvements. According to the users, the main advantage of the system is that it is well strucտured and once the system is learned it is easy to quickly access the information the doctors need. Additionally, according to the users, this system allows them to access the data without being dependent on the others (secretary, assistants etc.) and make reports instantly.
However, the users pointed out that there are some issues that should be solved. Firstly, as the system is web-based and requires a network connection, it may fail working as the local network system is not well defined in these hospitals. The administration of the hospitals are aware of this problem and they try to make the network more reliable. Secondly, the doctors require more analytical tools and graphs for their analytical researches and for their annual reports.
In the future the IS will include data analysis tools to analyze and visualize data. This part of the application is on development stage. Some statistical graphs like bar charts, line charts, pie charts will be used to show the result of the queries defined by the users. At the end of the pilot project, clinicians will be able to make their annual reports and research studies by using these tools in a quicker and easier way than using traditional methods.

CONCLUSIONS AND FUTURE WORK
The CM community reports that by using conceptual model-based software development strategies, a sound IS design process can be obtained. One of the main problems of this community is the lack of experimental evidence of this idea. From this point of view, the presented work provides an end-to-end software development example based on a CM specifically designed to solve data management problems in diagnosis and treatment of cancer´s domain, by providing a sound -methodologically speaking- fully CM-based design strategy and by implementing archetypes in order to create intuitive and easy-to-use UI. The proposed IS has been installed in two important public hospitals of Asunción, Paraguay making the first step to improve data management and analysis procedure in oncology departments. It is our next challenge to analyse how the system is working and to evaluate it according to the concrete clinical users’ experience.
The developed IS represents an integrated environment to manage clinical, genomic and biological data. It has an easy-to-use interface based on archetypes which makes data introduction, management and visualization easy and intuitive for clinicians. Its utility and practicality in the hospitals appears to be clear, being a useful tool for the health professionals’ daily work. The survey performed by the users showed high satisfaction level which also can be improved by the implementation of the analytical tools.
In addition to this, thanks to the use of archetypes designed following ISO-13606 standard, the IS is semantically interoperable and can share data with other systems too. It means that the IS can be easily connected with other ISs installed in different hospitals. This important feature is of great interest to the Ministry of Health of Paraguay, and an agreement has been reached to continue developing this IS to create a national Tumour Registry based on this work.

