




 English (pdf)
 Article in xml format
 Article references

 Automatic translation
 Send this article by e-mail
 Cited by SciELO
 Similars in
SciELO
 uBio

 Permalink


INTRODUCTION
Groundwater is an essential resource for socioeconomic progress, providing approximately 50% of the world's drinking water and accounting for 98% of the unfrozen freshwater1. Despite its importance, its quality can be compromised by the presence of naturally occurring inorganic compounds, which, depending on the geomorphology of the region, can be potentially harmful for human consumption2,3,4.
Fluoride is one of the most common natural contaminants in drinking water. In low concentrations, this ion is frequently added to drinking water to prevent dental caries, but in high concentrations, it can cause dental and skeletal fluorosis, affecting public health(5, 6, 7).
In 1981, it was discovered that fluoride forms very strong hydrogen bonds with amide functional groups in proteins8. Proteins are long-chain peptide polymers and their macromolecular structure is governed by hydrogen bonds formed between the N-H group of one amide fragment and the carbonyl group of another fragment on a parallel chain. So these amide hydrogen bonds are responsible for protein folding; when fluoride interferes with these hydrogen bonds, i.e. breaks them down, the characteristic protein configuration is altered and some specific protein properties might be lost. For instance, enzymes with a distorted spatial structure are sometimes considered as deactivated enzymes.
The double-stranded structure of the DNA is also stabilized hydrogen bonds involving amide groups. Any disruption of the hydrogen bonding of DNA by fluoride would certainly cause damage to the cell.
The effects of fluoride on the nervous system and endocrine glands of mammals, including the pineal gland have been extensively studied(9, 10). Concerns have risen that fluoride exposure leads to neuronal damage, such as Parkinson’s disease, Alzheimer’s disease, and a reduced intelligence quotient. Several studies have shown that fluoride exposure leads to oxidative stress and lipid peroxidation in the brain. Moreover, the production of enzymes responsible to produce energy in mitochondria can be inhibited. As a consequence, memory, and learning ability in animals and humans have been observed to be negatively affected9-17.
Fluoride occurs naturally in air, soil, water, and plants. The fluoride concentration in groundwater depends on geological and climatic factors, such as the presence of minerals like fluorspar, cryolite, micas, and clay minerals(3, 18, 19, 20).
In addition, its relationship with other elements such as calcium, magnesium, sodium, and potassium is crucial to understanding its dynamics. It has been shown that high fluoride concentrations often correlate with high sodium and low calcium levels, while the presence of calcium and magnesium can mitigate the toxic effects of fluoride(21, 22).
In the state of Paraguarí, Paraguay, access to groundwater is vital for rural communities. However, until now there are no systematic studies that evaluate fluoride concentrations in this region, which raises health concerns, given that some areas of the country are known for elevated concentrations of this ion in groundwater(23, 24, 25). This knowledge gap needs to be targeted through research that identifies fluoride levels and their potential risks to the population.
The World Health Organization (WHO) establishes a recommended maximum limit of 1.50 mg/L for fluoride in drinking water, a value also adopted by the Paraguayan Water Quality Standard NP 24 001 8026. Several studies have shown that the presence of fluoride in concentrations above this limit is associated with the occurrence of fluorosis and other health problems, especially in mountainous and arid regions, where water mineralization is more significant (4, 27, 28, 29).
In this scenario, the present study focuses on the state of Paraguarí, where, although symptoms of fluorosis have been observed in some areas, standardized studies on groundwater quality have not yet been carried out. Consequently, this research aims to evaluate the fluoride concentrations in different groundwater samples of this region. In addition, we try to correlate fluoride concentrations with the presence of other ions such as calcium, magnesium, sodium, and potassium.
MATERIAIS AND METHODS
Geographic location of the state of Paraguarí
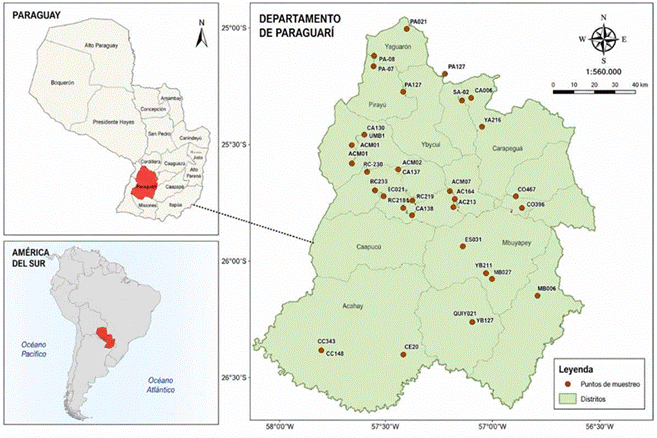
The region studied is in the southwest of the eastern region of Paraguay (Fig 1), limited to the state of Paraguarí. This state is geographically surrounded in the north by the states of Cordillera and Caaguazú, in the south by the state of Misiones, in the east by the states of Guairá and Caazapá, and in the west by the states of Central and Ñeembucú. Paraguarí has a total area of 8,705 km² and a population of 8,719 inhabitants. The region's climate is moderate-humid, with all-year-round rainfall and hot summers. The average annual temperature and rainfall are 22.2 °C and 1,384 mm, respectively. The rainiest periods are March-April and October-November.
Sampling and parameters
The study included 41 wells, distributed in the Department of Paraguarí, in addition to the criteria, according to recommendations from experts from the Paraguayan Network of Studies of Fluoride Exposure and the Treatment of Fluorosis. of CEMIT, include wells with a minimum depth of 100 m30 and wells that are in areas with people diagnosed with dental or bone fluorosis. The 41 sampled points were as detailed in the following table (Table 1).
All wells were deeper than 100m. Samples for fluoride determination were stored in 100 mL sterile polyethylene bottles, while those used for the analysis of the other ions were stored in 1L bottles. All bottles were previously washed with a 10% HNO3 (nitric acid) solution, following the laboratory's quality and biosafety protocols. The samples were sealed and properly stored before transport. All analyses were carried out at the Water Quality Laboratory of the Multidisciplinary Center for Technological Research.
Table 1: Sampling points for each district in the state of Paraguarí, Paraguay.
| District - Urban | Number of sampling points | Codification |
|---|---|---|
| Acahay | 4 | AC |
| Caapucu | 3 | Cu |
| Carapegua | 6 | CA |
| Escobar | 1 | ES |
| La Colmena | 2 | CO |
| Mbuyapey | 2 | MB |
| Paraguarí | 2 | PA |
| Pirayu | 2 | PI |
| Quiindy | 2 | QU |
| Quyquyho | 2 | QY |
| San R. González | 5 | RG |
| Sapucai | 2 | SA |
| Yaguarón | 4 | YA |
| Ybycui | 4 | YB |
| Total | 41 |
The fluoride concentration in the groundwater samples was determined potentiometrically utilizing an ion-selective electrode, as indicated in the Standard Methods for the Examination of Water and Wastewater (SM-4500-F-C). An OAKTON ION 6+ potentiometer, previously calibrated, was employed. For samples with significant fluoride content, the elements calcium (Ca2+) and magnesium (Mg2+) were determined by EDTA titration (SM-3500-Ca B y SM-3500-Mg B, respectively), while sodium (Na+) and potassium (K+) concentrations were quantified by atomic absorption spectroscopy using an air-acetylene flame (SM-3111 B). A Schimadzu, AA-7000 (APHA-AWWA-WEF, 2017) unit was used.
Statistical analysis
The obtained fluoride concentrations were compared with the maximum permitted levels established by the Paraguayan Drinking Water Standard (NP 24 001 80). To evaluate a possible correlation between fluoride concentration and the concentrations of calcium, magnesium, sodium, and potassium, the Pearson correlation coefficient (r) was calculated using IBM SPSS Statistics software. Then, the spatial distribution of fluoride was determined using the Kriging geostatistical interpolation technique, implemented in ArcGIS 10.1. software 31.
RESULTS AND DISCUSSION
Evaluation of fluoride concentrations at different points
Fluoride concentrations recorded in the groundwater samples ranged from 0.01 to 3.30 mg/L (Table 2). Most of the samples presented low fluoride concentrations, except Yere and Montiel Potrero, belonging to the Caapucú district. The pH values ranged between 5.26 and 7.29. García et al.4 mention that an alkaline environment (7.6-8.6) with high
bicarbonate concentration favors fluoride dissolution in groundwater. In contrast, Gutiérrez and Alarcón-Herrera32 noted that at lower pH, fluoride speciation tends to show a higher proportion of F complex ions.
The World Health Organization states that dental fluorosis occurs more likely when fluoride concentrations in drinking water exceed 1.5 mg/L, while skeletal fluorosis tends to manifest at concentrations higher than 3 mg/L. Both conditions result from chronic exposure to elevated levels of fluoride.
Table 2: Fluoride concentrations and recorded parameters.
| Nº | District - Urban | Code Well | Prof. (m) | F mg/L-1 | pH | Cond ms/cm |
|---|---|---|---|---|---|---|
| 1 | Acahay | AC114 | 160 | 0.01 | 6.14 | 42.3 |
| 2 | Acahay | AC166 | 120 | 0.00 | 5.26 | 51.1 |
| 3 | Acahay | AC203 | 100 | 0.01 | 5.8 | 9.92 |
| 4 | Acahay | AC222 | 150 | 0.01 | 6.39 | 78.4 |
| 5 | Caapucu | CU121 | 102 | 3.20 | 6.74 | 331 |
| 6 | Caapucu | CU143 | 126 | 3.30 | 7.29 | 594 |
| 7 | Caapucu | CU144 | 121 | 2.50 | 6.03 | 43.7 |
| 8 | Carapegua | CA085 | 132 | 0.00 | 6.18 | 30.3 |
| 9 | Carapegua | CA110 | 126 | 0.02 | 5.67 | 41.7 |
| 10 | Carapegua | CA133 | 150 | 0.01 | 5.97 | 34.7 |
| 11 | Carapegua | CA187 | 122 | 0.01 | 5.79 | 47.7 |
| 12 | Carapegua | CA191 | 150 | 0.01 | 7.28 | 436 |
| 13 | Carapegua | CA221 | 120 | 0.14 | 6.9 | 183.9 |
| 14 | Escobar | ES031 | 152 | 0.00 | 5.64 | 48.2 |
| 15 | La Colmena | CO167 | 150 | 0.01 | 6.18 | 131.6 |
| 16 | La Colmena | CO286 | 104 | 0.04 | 6.2 | 52.6 |
| 17 | Mbuyapey | MB036 | 124 | 0.00 | 5.82 | 46.7 |
| 18 | Mbuyapey | MB092 | 150 | 0.01 | 5.85 | 49.5 |
| 19 | Paraguari | PA054 | 150 | 0.01 | 6 | 37.8 |
| 20 | Paraguari | PA125 | 108 | 0.02 | 6.84 | 198.3 |
| 21 | Pirayu | PI195 | 104 | 0.00 | 5.79 | 9.88 |
| 22 | Pirayu | PI253 | 120 | 0.00 | 6.09 | 7.69 |
| 23 | Quiindy | QU211 | 150 | 0.00 | 5.83 | 51.1 |
| 24 | Quiindy | QU235 | 117 | 0.00 | 5.78 | 81.5 |
| 25 | Quyquyho | QY018 | 153 | 0.18 | 5.7 | 10.17 |
| 26 | Quyquyho | QY145 | 112 | 0.52 | 5.85 | 9.42 |
| 27 | San R. Gonzalez | RG039 | 105 | 0.00 | 6.19 | 111.6 |
| 28 | San R. Gonzalez | RG098 | 110 | 0.04 | 5.87 | 29.6 |
| 29 | San R. Gonzalez | RG142 | 105 | 0.00 | 6.14 | 36.7 |
| 30 | San R. Gonzalez | RG154 | 105 | 0.00 | 6.81 | 62.9 |
| 31 | San R. Gonzalez | RG232 | 150 | 0.68 | 6.4 | 35.3 |
| 32 | Sapucai | SA194 | 132 | 0.00 | 6.83 | 154.3 |
| 33 | Sapucai | SA283 | 169.5 | 0.01 | 5.84 | 43.6 |
| 34 | Yaguaron | YA044 | 105 | 0.00 | 5.78 | 134.7 |
| 35 | Yaguaron | YA198 | 138 | 0.01 | 5.89 | 64.4 |
| 36 | Yaguaron | YA247 | 120 | 0.00 | 6.52 | 163.3 |
| 37 | Yaguaron | YA252 | 146 | 0.00 | 5.68 | 53.4 |
| 38 | Ybycui | YB010 | 105 | 0.00 | 6.02 | 117.1 |
| 39 | Ybycui | YB056 | 100 | 0.01 | 6.01 | 31.2 |
| 40 | Ybycui | YB171 | 125 | 0.00 | 5.89 | 43 |
| 41 | Ybycui | YB257 | 121 | 0.00 | 5.48 | 53.6 |
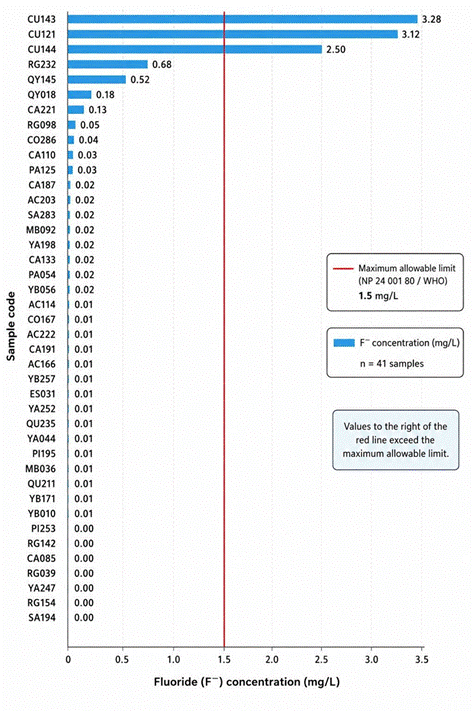
Considering the maximum allowable concentration of fluoride (1.5 mg/L) according to the Paraguayan Drinking Water Standard (NP 24 001 80), 93% of the sampled wells (38 samples) meet national and international standards. However, 7% of the samples (3 wells) exceed this limit, with concentrations higher than 2 mg/L. Figure 2 shows the fluoride
concentrations obtained, where wells CU121, CU143 and CU144 stand out, which greatly exceeded the permitted limit. Well CU143 recorded the highest concentration, with 3.30 mg/L.
These results are consistent with those obtained by the Ministry of Environment and Sustainable Development6 in the region “Cuenca Hídrica del arroyo San Lorenzo”, where 95.38% of the samples presented concentrations between 0 and 0.5 mg/L. Similarly27 reported that 8% of the samples in the district of Loreto, Department of Concepción, exceeded the allowable limit. However, the results differ from those reported by DIGESA in Borja25, located in the state of Guairá, where fluoride concentrations ranged from 0 to 21.8 mg/L, significantly exceeding the concentrations observed in this study. It is important to note that these results coincide with the observations25, who noted the presence of natural fluoride concentrations equal to or higher than 1.5 mg/L in the departments of Alto Paraná, Concepción, San Pedro, and Paraguarí.
These authors suggest7 that elevated fluoride concentrations may be associated with the presence of minerals such as clay, mica, dolomite, and limestone, hydrogeological features also observed in the region of this study.
Notably, all three wells exceeding the drinking-water guideline for fluoride (CU121, CU143, and CU144) were located in the Caapucú district. This spatial clustering is relevant because Caapucú is situated within a geologically distinct domain associated with the Caapucú High and Precambrian-Neoproterozoic crystalline rocks. Groundwater occurrence in this setting is largely controlled by fractures and weathered zones in crystalline rocks. Therefore, the concentration of fluoride anomalies in this area suggests that local geological and water-rock interaction processes may contribute to fluoride enrichment. However, because detailed lithological logs and aquifer assignments were not available for all sampled wells, the present data do not allow a definitive attribution of the elevated fluoride concentrations to a specific geological formation or aquifer. Further hydrogeochemical and geological investigations are required to test this hypothesis.
Description of the spatial fluoride distribution
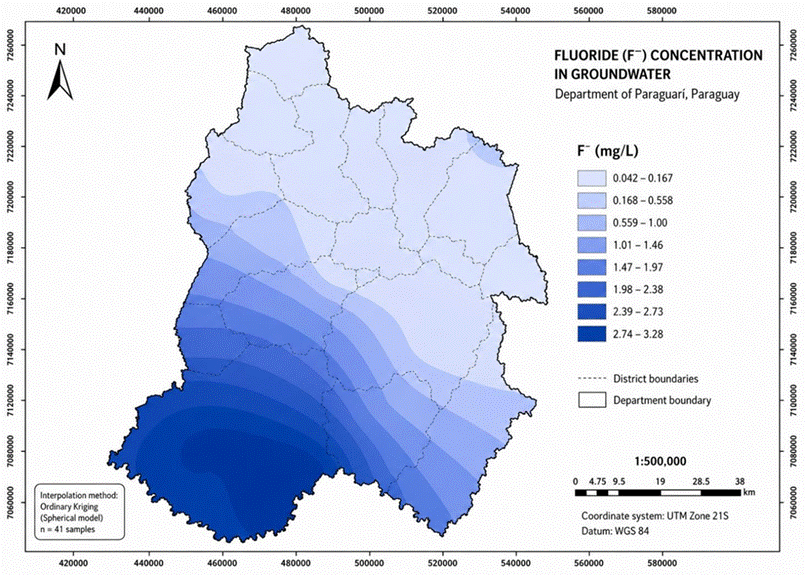
Figure 3 shows the spatial distribution of fluoride in the state of Paraguarí estimated by the Kriging interpolation method. The areas with the lowest concentration are located in the northeast, while the highest concentrations are found in the southwest, suggesting a relatively uniform distribution over much of the area. The areas represented in light and dark blue tones correspond to areas with low fluoride concentrations, within the permitted limits. In contrast, the dark blue areas indicate concentrations that exceed the maximum allowable limit. These results are consistent with those reported by the Ministry of Environment and Sustainable Development4, which observed a uniform distribution of fluoride in the “Cuenca Hídrica del Arroyo San Lorenzo”, without the presence of elevated concentrations. Similarly documented a heterogeneous geographic distribution of fluorides in the province of Tucumán, Argentina, differentiating between areas with deficit, excess, and concentrations within the recommended values33.
Correlation of fluoride with calcium, magnesium, sodium, and potassium.
Figures 4 and 5 show graphically possible correlations between fluoride and other compounds (Ca, Mg, K, Na) in the groundwater. Only samples with significant fluoride concentration were considered (5 wells). Numerical values of the measured concentrations are given in Table 3.
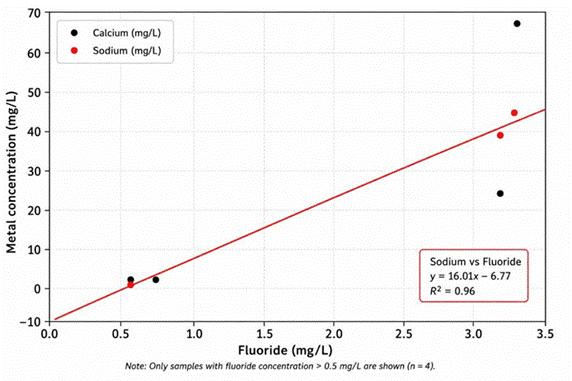
Figure 4: Graphical detection of correlations between fluoride and sodium or fluoride and calcium. The red line is a linear fit of the sodium concentration versus fluoride concentration.
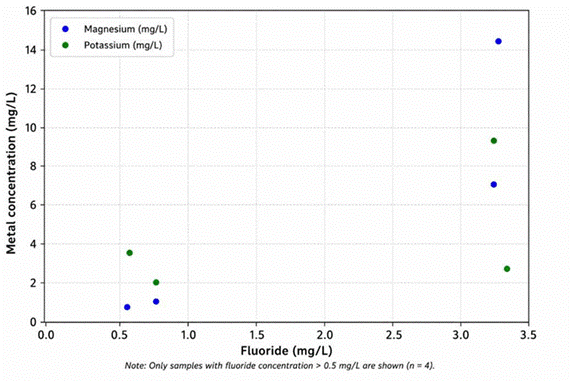
Figure 5: Graphical detection of correlations between fluoride and magnesium or fluoride and potassium.
As can be seen from these figures, only sodium exists in a linear concentration dependence on the fluoride concentration. The red line in Figure 4 is a linear fit of these concentration data with the slope of 15,23 mg sodium / 1 mg fluoride. This can be expressed as millimol Na per millimol F-, dividing the mass values by the corresponding atomic masses, i.e., 15.24 mg / 22.99 g/mol = 0.66 mmol, and 1 mg /9.499 g/mol = 0.11 mmol. This means that for every fluoride anion in solution, there are 6 sodium cations present (0.66/0.11 = 6).
These results are consistent with previous findings that reported moderate correlations between fluoride and Mg²⁺, Ca²⁺, and K⁺7. These findings suggest that elevated fluoride, Ca²⁺, and Mg²⁺ concentrations are likely associated with evaporative conditions and increased salinity, as reflected by parameters such as electrical conductivity (EC), total dissolved solids (TDS), and elevated Na⁺ and Cl⁻ levels21. A strong positive correlation between sodium and fluoride (r = 0.985) was also reported [30]. Several studies have reported strong positive correlations of F⁻ with Na⁺ and K⁺, whereas negative correlations have been reported with Ca²⁺ and Mg²⁺20.
However, the dissolution of fluoride-containing minerals should generate a positive correlation with Ca²⁺ and Mg²⁺. This could be explained by the reverse ion exchange process, where Na⁺ present in an aquifer mineral is exchanged for Ca²⁺ and Mg²⁺ cations in groundwater. A global assessment of fluoride contamination in water cited multiple studies reporting correlations between fluoride and various ions22. Positive correlations between F⁻ and Na⁺, Ca²⁺, and Mg²⁺ have also been reported34,35, whereas negative correlations between F⁻ and Ca²⁺, Mg²⁺, and K⁺ have been documented36.
Table 3: Cation values in wells with high, medium and low fluoride concentrations.
| Code Well | F mg/L-1 | Ca+2 | Mg+2 | Na+ | K+ |
|---|---|---|---|---|---|
| CU143 | 3.30 | 67.86 | 14.362 | 45.42 | 2.67 |
| CU121 | 3.20 | 24.53 | 7.070 | 39.95 | 9.33 |
| RG232 | 0.68 | 2.45 | 0.976 | 3.44 | 3.06 |
| QY145 | 0.52 | 2.45 | 0.731 | 1.33 | 3.58 |
| MB036 | 0.00 | 2.45 | 0.976 | 1.79 | 2.76 |
| PI253 | 0.00 | 1.64 | 0.732 | 0.74 | 1.25 |
CONCLUSIONS
This work emphasizes the importance of future studies to evaluate the dynamics of other related elements. This work emphasizes the importance of future studies to evaluate the dynamics of other related elements, such as calcium, magnesium, sodium, and potassium, which could be influencing the distribution and concentration of fluoride in the region.
This study on fluoride concentration in groundwater in the state of Paraguarí reveals that most of the analyzed samples present fluoride levels within the limits allowed by Paraguayan and WHO regulations. However, a small percentage of wells, mainly in the district of Caapucú, exceed these limits, posing a potential risk to public health, particularly concerning dental and skeletal fluorosis. Therefore, it is suggested that specific monitoring and treatment strategies, such as the application of efficient technologies for fluoride reduction in affected water sources, should be implemented to ensure the sustainability of drinking water sources and protect the health of local communities.

