1. INTRODUCCIÓN
Ypacarai Lake, with an approximate surface area of 90 km2 and an average depth of 3 m, is one of Paraguay's most valuable water resources. It is a popular place for tourism, used as water supply in the fields, for livestock, agriculture, and industrial activities. Unfortunately, the development around the lake was not accompanied by an environmental protection policy for controlling pollutants. Nowadays, this lake is alarmingly polluted, mainly due to the significant discharge of nutrients from urban and industrial organic waste1. Accumulation of these nutrients aggravates the presence of algae that, together with other compounds present in high concentrations, decrease water quality, and hinder the life of the species that inhabit it.
Recently, several projects have been carried out to respond to the urgent need to recover the lake. Most of them are based on collecting data for understanding its health and structure, including the bathymetric mapping and chemical analysis of the lake2-4. Facetti (2013)5 mentioned important factors that affect the lake's water quality, including nutrients, presence of colloids in high concentration, thermal stratification, and wind. Data about contaminants in tributaries and information about physicochemical properties of some sub in different sites of the lake are presented in CEMIT (2017)6.
Now, governmental agencies are working on an integrated sanitation plan for the basin and designing a water treatment plant, bioremediation techniques, and continuous monitoring, among other actions for recovering the lake's health2,1. Unfortunately, despite the effort, contaminant concentration levels (and eutrophication) are still higher than the allowed levels specified by environmental agencies. This work is based on the premise that it is necessary to improve the understanding (using a systemic point of view) of the lake dynamics to address the pollution problem.
Each lake has its own characteristics associated with its ecosystem, and consequently, each of them has its own particularity of modeling7-9. Hydrodynamic properties of a lake are determined by many factors such as geometry, advection, wind effects, the structure of its bottom (rock, sand, mud, and the presence of vegetation), and the basin9,10. The wind is an important driving force in shallow lakes. Wind shear stress at the surface generates waves and influences the exchange processes at the bottom7, promoting mixing of the water body and pollutant transport across the lake11.
Lake Ypacarai's horizontal dimension is much larger than the vertical one, and therefore, it can be considered a shallow-water lake8,12,13. Oporto et al. (2015, 2016)14-15 presented an analysis of the wind influence in the contaminant transport in the Lake Ypacarai hydrodynamics. The results showed the strong impact of wind shear stress in the simulations.
In this paper, we analyze the distribution of a non-reactive contaminant in the lake Ypacarai using a shallow water model for the hydrodynamics and considering the effects of the bottom, wind, and inflow-outflow on its tributaries. The simulation results are compared with analysis of water samples obtained regularly by governmental agencies and obtained from the literature. The results show a maximum error of approximation of 17% and an average error of 8%, inferring that the implemented model captures the main phenomenology of the Ypacari Lake. The results show the strong influence of wind direction and the sensitivity of having appropriate modeling of the lakebed on the distribution of the contaminants. The simulation identifies critical places for the accumulation of pollutants. Based on the results, we recommend convenient locations where monitoring must be focused to obtain the lake's accurate and complete state.
This paper is organized as follows. In §2, the governing equations and implemented algorithm are introduced. In §3, the validation of the model is performed, using the implemented algorithm for a simple problem, and contrasting the obtained numerical results with an analytical solution. In addition, a mesh independence test is performed and discussed in section §4. In §5, the Lake Ypacarai, its boundaries, and inflow conditions are described. In §6, the numerical results of the numerical model are discussed, and some concluding remarks are presented in §7.
2. MODEL DESCRIPTION
This section introduces the model used to simulate the hydrodynamics of the lake, as well as the transport model for the pollutant dispersion and the numerical approach to solve them.
2.1. Governing Equations
Two-dimensional Shallow Water Equations (SWE) are often used to model the lake hydrodynamics when the lake depth is several orders of magnitude smaller than the other dimensions8. Following this, the transport equation models the contaminant distribution over the lake under different wind conditions. The SWE can be written as16,17.
where u 𝑖 (i = x, y) are the depth-averaged flow velocities (𝑢, 𝑣) in 𝑥 and 𝑦, ℎ is the water depth from the bed to the surface of the lake (Figure 1), 𝑧 0 the bed elevation measured from the coordinate system, 𝜏 is the momentum diffusion term, 𝜏 𝑠𝑜 is the horizontal component of the bed friction, 𝜏 𝑤 is the wind stress, 𝜌 is the water density, and 𝑔 is the gravity acceleration. The Coriolis and turbulence terms are neglected in this model.
Wind stress terms at the surface represent the drag force produced by the wind over the water surface18. These terms are expressed as a function of wind velocity19,20 as follows
where 𝜏 𝑤,𝑥 and 𝜏 𝑤,𝑦 are the wind stress components in 𝑥 and 𝑦 directions, 𝑈 𝑤 and 𝑉 𝑤 are the wind velocity components at 10m elevation in 𝑥 and 𝑦 directions, respectively, and 𝜌 𝑎 is the air density. The drag coefficient 𝐶 𝑑 may vary with wind speed19. For shallow water bodies, longer water waves will not be able to develop completely, and consequently, the water surface remains smoother21. In such cases, the value of 𝐶 𝑑 remains close to 10-3 (19,20.
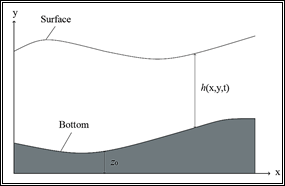
Figure 1 Depth considerations, h is the water depth, from the bed to the surface of the lake and 𝑧 0 is the bed elevation measured from the base of the coordinate system. Modified from Marqués (2004)22.
Bottom stress has a non-linear effect of retarding the flow, causing flow velocity loss at the fluid-bottom interface18. This stress depends on the lakebed characteristics (shape and roughness), fluid properties (viscosity), and others, such as depth and flow velocity21,23. It is usually estimated with empirical or semi-empirical equations, such as Manning's equation18, which is written as follows,
where 𝑐 𝑓 is the friction coefficient, 𝑔 is the gravity, and 𝑛 is the Manning's coefficient, which is difficult to calculate because of the many variables that affect the flow. Therefore, observed variables from tables, including field and laboratory experiments for natural water resources, are used extracted from Chow (1959)24. In this work, we consider 𝑛=0.03, the usual value for natural channels, assuming a system without wells, with some stones and vegetation.
To model the dispersion of a contaminant within the lake, we use the depth-averaged scalar transport equation, which is solved coupled to the hydrodynamic equations. Chemical reactions are not considered. Hence, we obtain,
where, 𝑐 is the scalar concentration, and 𝐷 is the diffusion coefficient. Total phosphorus values are used to compare the model results with the available data.
2.2. Numerical simulation
Equations are discretized by the Finite Volume Method (FVM), and the system of equations is solved with the open-source CFD software OpenFOAM25. The ShallowWaterFoam solver for inviscid shallow-water equations is adapted to this problem incorporating the terms corresponding to viscosity, wind, and bottom effects in the solver. The iterative process of the solver is based on the PIMPLE algorithm26, which uses a predictor/corrector scheme (Figure 2). In the predictor step, approximated values of the velocity components are used to evaluate the momentum equation. A constant depth ℎ with respect to the previous time is assumed, as well as the value of ℎ𝑢 in the convective, diffusive, and bottom stress terms. With these assumptions, the corrected value ℎ 𝑢 ∗ is computed. In the corrector step, the term ℎ 𝑢 ∗ is used to correct the pressure by computing a new ℎ ∗ which is used to calculate a new value ℎ 𝑢 ∗∗ . Three iterations are made for the corrector step since the tolerance is reached after this number of iterations27. This process is repeated until the simulation time is complete.
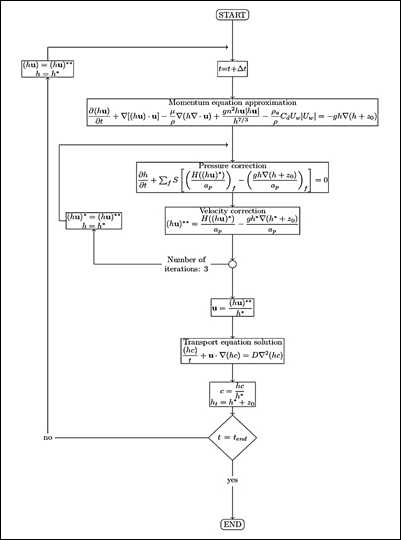
Figure 2 Solver algorithm with the discretized equations. In the Figure, S is the vector in the face cell surface, 𝑎 𝑃 includes the terms of the owner cell and 𝐻(hu) contains the terms in the neighboring cells and the source terms except for the pressure. The subscript f indicates that the equations are solved in the cell faces. In the predictor step, constant values of h and h𝒖 are assumed. The corrector step is iterated three times to ensure convergence. Then the transport equation is solved, and the process is repeated up to the end time.
3. MODEL VERIFICATION
This section describes the verification process based on similar studies on lakes. The verification process is performed by comparing the solver results with the analytical solutions. The relative mean percentage error values are calculated % error ,
where 𝑁 is the number of evaluated cells. We consider that the steady-state is reached when the relative variation at the end of the simulation is smaller than 5⋅ 10 −3 . This value is derived from previous experiments with the solver. The relative variation is calculated by,
This study mainly follows the techniques described in Delestre et al. (2013)28 and Koçyigit and Falconer (2004)29.
3.1. Viscous effects verification
Considering a unidimensional steady-state system (𝒙 direction), with no wind and bottom effects, and constant flow velocity
the analytical solution of 𝒉 is given by,
and the bed elevation 𝑧 0 is obtained from,
where 𝑞=ℎ𝑢. The test case is a channel of 𝑥=1000 m, where the inflow condition is a constant discharge of 𝑞=1.5 m2s-1, and the outflow condition is a constant height of ℎ(1000)= 0.748324 m. The viscosity value is 𝜇= 0.1 Pas. The mesh has 200 cells (𝛥𝑥=5 m), and the simulation time is 4000 s with a time step (𝛥𝑡) of 1 s29. The channel is initially dry (ℎ=0 m and 𝑞=0 m2 s-1), and the steady-state is reached at 1500 s. Figure 3(a) shows the comparison between the reference and obtained data. The mean relative error is 1.94%.
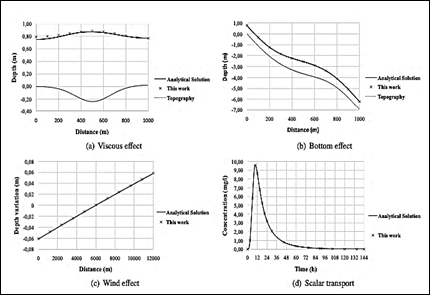
Figure 3 Model verification. (a) viscous effect, (b) bottom effects, (c) wind effect, and (d) scalar transport.
3.2. Bottom Effect
In this case, the bed friction is included, and the viscous effects are neglected, i.e.,
Then, the analytical solution of ℎ is given by28,
and the bed elevation 𝑧 0 is obtained from,
Initial and boundary conditions are like the previous case. The channel geometry is 𝑥=1000 m long with a mesh of 200 cells (𝛥𝑥=5 m). The inflow condition is a constant discharge of 𝑞=2 m2s-1, and the outflow condition is a constant height of ℎ(1000)= 0.748324 m. Manning’s coefficient value is 𝑛 = 0.033 sm-1/3. The simulation time is 4000 s with a time step (𝛥𝑡) of 1 s 29. The channel is initially dry (ℎ=0 m and 𝑞=0 m2s-1), and the steady-state is reached at 600 s. Figure 3(b) shows the comparison between the reference and obtained data. The mean relative error is 0.32%.
3.3. Wind Effect
In this case, we consider a closed container with a free surface containing a fluid, where the only effect is the wind. Viscosity and bottom friction effects are neglected
The analytical solution is
The geometry is a channel of 𝑥=12000 m long with a mesh of 12 cells. There is no flow in the boundaries (𝑢=0 ms-1). The parameters are the wind stress 𝜏 𝑤𝑖𝑛𝑑 = 0.1 Nm-2, water density 𝜌=1026 kgm-3 and gravity 𝑔= 9.81 ms-2. The simulation time is 500 h with a time step (𝛥𝑡) of 60 s29. The steady-state is reached at 320 h. Figure 3(c) shows the comparison between the reference and obtained data with respect to time 𝑡=0. The mean relative error is 2.23%.
3.4. Scalar Transport
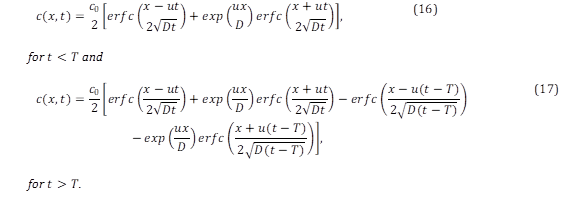
This test case is a hypothetical one-dimensional river with constant depth and velocity19. During a finite period 𝑇, a continuous source of a conservative scalar flows downstream through a straight channel under the unsteady condition. The scalar concentration can be expressed by the following analytical solutions30.
Inflow and outflow conditions are fixed velocities of 𝑢=0.03 ms-1, depth ℎ=10 m, diffusion coefficient 𝐷=30 m2s-1, feeding time 𝑇=21600 s, initial concentration 𝑐 0 =300 mgl-1 and length 𝑥 𝑡𝑜𝑡𝑎𝑙 =11400 m. A mesh of 114 cells is used (𝛥𝑥=10 m). The simulation time is divided in two-time parts, 0 to 6h and 6 to 144 h. During the first part, the contaminant is introduced from upstream. It is stopped during the second part. The time step for both stages is 10 s. Figure 3(d) shows the concentration at 𝑥=2000 m for the numerical model and the analytical solution. The mean relative error is 0.83%.
4. MESH VERIFICATION
A mesh independence study is carried out. This test consists of performing simulations under given conditions using several levels of refinement to obtain a mesh that appropriately represents the system's behavior at a relatively low computational cost and in the shortest possible time. In this work, two refinements are made to the original (unrefined) mesh. Simulations are run under the same conditions (see parameters in Table 1) for the three levels of refinement. The number of cells and processing time for each case can be seen in Table 2. In this analysis, the unrefined mesh presents noticeable deviations from the other two, and therefore this mesh is discarded.
For evaluating the other two cases, six points with non-zero concentration values were arbitrarily chosen for the test. The concentration values and their relative variation at each measurement point are summarized in Table 3. The error is low between the refinements (less than 3%), but there is a lot of difference in the processing time (four times faster in the refined mesh 1). Consequently, we use mesh 1 for the numerical experiments.
Table 1. Parameters used for the mesh independence study
| Parameter | Symbol | Value | Measurement unit |
| Water density | ρ | 1000 | kgm-3 |
| Drag coefficient | Cd | 1∙10-3 | - |
| Air density | Ρ a | 1.29 | kgm-3 |
| Wind speed | U w | 0 | ms-1 |
| Manning's coefficient | n | 0.01 | sm-1/3 |
| Diffusion coefficient | D | 0.89∙10-9 | m2s-1 |
| Initial time | t 0 | 0 | s |
| Final time | t | 100000 | s |
| Time step | Δt | 5 | s |
Table 2 Number of cells and processing time of the different refinement levels considered
| Mesh | Number of cells | Mean size of cell (m2) | Processing time |
| Unrefined mesh | 8205 | 7823.1 | 14 min 49 s |
| Refined mesh 1 | 30281 | 2119.8 | 55 min 15 s |
| Refined mesh 2 | 116049 | 553.1 | 3 h 42 min 13 s |
5. MODEL APPLICATION
5.1. Study area
Lake Ypacarai is located between the departments of Central and Cordillera, and it is approximately 14 km long and 6 km wide. The water depth ranges from 0.77 m to 3.2 m, with the deepest zone at the lake's center.

Figure 4 Measurement points of the 14th Water Quality Monitoring Campaign. This Map was generated with Google Earth considering the coordinates mentioned in the report
Several streams flow into this lake. The main tributaries are the Yukyry and Pirayu streams, while other streams with minor contributions are located in the east and west areas of the lake. In addition, the lake water flows into the Paraguay river through the Salado river2.
For several years, the lake's pollution has been aggravated mainly because of the tremendous human activity in the surrounding areas. Quarterly water quality monitoring reports from national agencies are available for the public. They include measurements of physicochemical and biological parameters at several points (Figure ). These reports also have reference values for optimal conditions of the lake6.
5.2. Boundary and initial conditions
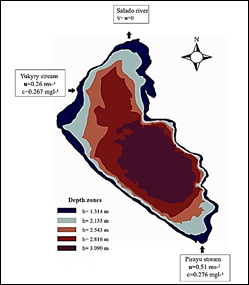
The border of the lake is divided into two sectors: a part corresponding to the tributaries and the affluent, and the rest of the boundary. In the contour, except the tributaries, free-slip boundary conditions are considered. For the inflow streams, linear flow velocities are used as Dirichlet boundary conditions (U1=0.26 ms-1 and U2=0.51 ms-1). The outflow has zero velocity gradient (Figure 5).
Initial values of the variable height ℎ are the five bathymetric regions obtained from national agencies reports, whereas the bottom heights 𝑧 0 in each region are calculated with the formula 𝑧 0 =(3.09−ℎ), where 3.09 is the maximum depth of the lake.
We consider an initial value of zero for the pollutant inside the domain and that it enters the lake by the inflow affluents with constant concentration values ( 𝑐 1 =0.267 mgl-1 and 𝑐 2 =0.276 mgl-1). Table shows the parameters that remain constant during simulations.
Table 4 Parameters, symbols, and values employed in the simulations. Wind speed and direction depend on the case of study
| Parameter | Symbol | Value | Measurement unit |
| Water density | ρ | 1000 | kgm-3 |
| Drag coefficient | 𝐶 𝑑 | 1∙10-3 | - |
| Air density | 𝜌 𝑎 | 1.29 | kgm-3 |
| Wind speed | 𝑈 𝑤 | 1.01 or 2.83 | ms-1 |
| Manning's coefficient | 𝑛 | 0.03 | sm-1/3 |
| Diffusion coefficient | D | 0.89∙10-9 | m2s-1 |
| Initial time | t 0 | 0 | s |
| Final time | t | 1000000 | s |
| Timestep | 𝛥𝑡 | 5 | s |
6. RESULTS AND DISCUSSION
The numerical analysis of the Ypacarai Lake real case scenario is performed in three experiments. The first experiment is the study of both wind and bottom stresses effects on the lake hydrodynamics (see § below). The second experiment (see § below) is the simulation of contaminant dispersion in the lake considering different wind directions: north (N), south (S), east (E), and west (W). Finally, we compare the numerical results against field measurements of the monitoring campaign mentioned in § (see § below). According to national agencies, the east-wind direction was predominant during the sampling period. Therefore, the results for this wind direction are analyzed.
For the first and third experiments, the wind speed is 1.01 ms-1 in the east direction. This value was obtained by averaging wind speed from the 20 days before the monitoring campaign6. Wind data was provided by a national agency31. In the second experiment, a higher wind speed (2.83 ms-1) is chosen arbitrarily to make the wind influence more preponderant and appreciate the phenomenon under analysis more clearly.
6.1. Experiment 1: Hydrodynamic profile for wind and bottom effects
Figure 6 shows the lake hydrodynamics for 𝑡=700000 s. First, only the wind effect is considered, and the impact of the lakebed at the bottom is neglected. Due to the absence of any other inflow than the tributaries, the flow velocities from tributaries are dominant in the lake, causing high-velocity gradients inside the lake.
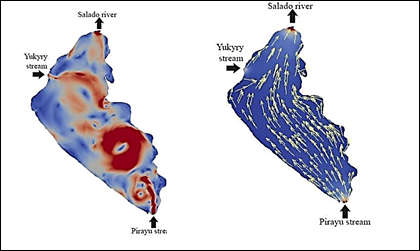
Figure 6 Simulation results at several times considering wind and bottom forces. Wind speed is 1.01 ms-1 in the East direction, t=700000 s.
The wind velocity is considered as a constant of 1.01 ms-1 in the east direction. This experiment allows analyzing the influence of wind forces in the structure of the internal flow of the lake. Observe that dissipation effects and wind forces acting on the tributary flow result in an irregular flow with large eddies. Recall that for the simulation of this case the wind is considered a constant, and the dissipative force due to the lakebed is neglected. Figure 6(b) shows how bottom stress enables the flow to follow a smooth trajectory from the tributaries to the Salado River, with higher speeds in the shallowest areas. Flow velocity varies minimally with time, showing the natural structure of the flux in the lake without external forces except for the lakebed stresses.
We observe that when the bottom stress is not considered, flow velocities in some areas are in the order of 10-1 ms-1 even exceeding the inflow velocities. When the bottom stress is taken into account, flow velocities magnitudes are in the order of 10-2 ms-1, which are similar to magnitudes encountered in the literature (see, for instance, Beletsky et al. (1999)32).
6.2. Experiment 2: Concentration profile under different wind directions
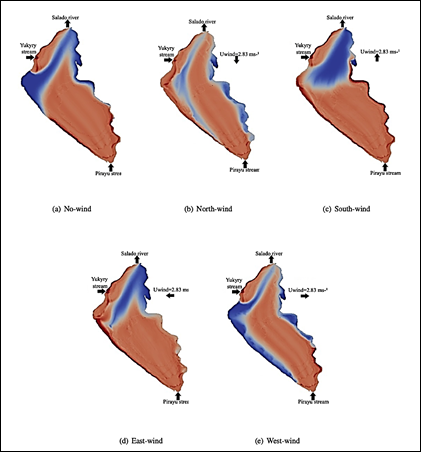
Contaminant concentration profiles under different wind configurations are shown in Figure 7. In these cases, the wind speed is 2.83 ms-1. In all simulations, the contaminant inflow into the lake through the Yukyry and Pirayu streams. In the absence of wind (Figure 7(a)), the contaminant from the Yukyry is forced to be confined in a region between the Yukury and Salado (which is the outflow tributary of the lake).
Furthermore, the contaminant coming from the Pirayu evolves to reach all the lake. Another observation is the more prominent level of contamination at the coasts of the lake. This point is going to be discussed later.
Comparing Figures 7(a) and 7(c), it is possible to observe that the 2D profile of contaminants has a similar smooth flow pattern and contaminant distribution. In the south wind case (Figure 7(c)), the pollutant introduced through the Pirayu stream distributes faster along the shores than the lake's center. This particularity occurs because the water body has considerable inertia to the direction of flow and wind. Consequently, the dominant flow transporting the pollutant is in the shallower regions of the lake than in its center.
When the North wind direction (Figure 7(b)) is considered, the contaminant flows preferentially from the Pirayu stream to the outflow through the center. In addition, the structure of the flow is almost symmetrical in the west and east shores. The pollutant from the Yukyry is forced to the coast, diffusing in parts to the Salado River and to the coast of Areguá. At the end of the simulation, higher scalar concentrations are found in the southwest shores and lower in the eastern shores. This means that the contaminant is concentrated between the coast of Areguá and Ypacarai.
For East wind condition (Figure 7(d)), the contaminant transports from the Yukyry stream to the west shore following the wind direction before heading towards the outflow. The same effect is observed for the contaminant entering from the Pirayu stream, where the transport is faster in the west shore region. Thus, the concentration is higher on the west coast, especially where the currents from the two inflows converge (Figure 7(d)).
For West wind conditions (Figure 7(e)), the contaminant dispersion is faster in the deeper zones towards the outflow. Contaminant accumulation is higher on the southeast coast and lower on the west and northeast coasts (Figure 7(d)).
Finally, the results show a strong influence of the wind in the contaminant distribution. Its effect is particularly notorious in the shores, where the flow tends to take the wind direction, according to the literature12,31.
6.3. Experiment 3: Real case comparison
Ypacarai Lake is located in a subtropical region. This means that its external forces condition strongly depends on the season of the year. The prevailing East wind direction is considered to compare the numerical results with the data collected and the information obtained from the governmental institutions. Consequently, the comparison is performed using this direction of the wind.
Figure 8 shows the 2D profile of concentration distribution of contaminant when the east wind direction is considered having a wind speed of 1.01 ms-1. Comparing Figure 7(d) and 8, it is observed that the speed of velocity affects contaminant distribution. Both situations are real possible cases depending on the season and the time of the year.

Figure 8 Concentration profile for an East wind condition with velocity speed of 1.01 ms-1 in the east direction. These values were compared with field measurements from national agencies.
Table 5 shows the error between the value of contamination obtained by the simulation and the measurement value MP. The measurement of chemical phosphorus used for the comparison corresponds to the data collected during the monitoring campaign mentioned in §6. On average, the errors are relatively low (no more than 10%). This corroborates the fundamental structure of the lake's flow, and the distribution of contaminants in the lake can be efficiently estimated and predicted.
Table 5 Comparison between the numerical simulation results with an East wind direction of wind speed of 1.01 ms-1 and field measurements of phosphorus collected during the monitoring campaign of the Lake Ypacarai (6).
| Measurement point | Real | Model | Error (%) |
| MP1 | 0.265 | 0.272 | 2.64 |
| MP2 | 0.224 | 0.226 | 0.89 |
| MP3 | 0.188 | 0.220 | 17.02 |
| MP4 | 0.204 | 0.219 | 7.35 |
| MP5 | 0.218 | 0.242 | 11.01 |
| Mean error (%) | 7.78 |
7. CONCLUSIONS
This article developed a shallow-water numerical model to simulate the hydrodynamics and contaminant transport under several wind configurations in Ypacarai Lake. The solver was specified to reach a predefined accuracy comparing the numerical results with analytical ones, and the mesh was chosen to computational resources (saving memory and computational time). In the simulations, it can be observed that the diffusion introduced by the lakebed stabilizes the flow avoiding the formation of large eddies. The influence of the wind directions can also be observed. It strongly affects the hydrodynamics and the distribution of contaminants.
Moreover, the simulation shows regions in the lake that are more likely to accumulate pollution. This is due to the combination of the wind direction, the lakebed, and the value of the flow velocity in those regions. Such regions of low-velocity flow are potentially more dangerous in case of a local discharge of pollutants.
The difficulty of predicting the distribution of contaminants in this lake relies on the fact that the predominant wind can take all the directions presented in this paper depending on the season of the year and even the hour of the day. This characteristic makes it especially difficult for quantitative predictions. The validation of the model was performed by contrasting field measurements of total phosphorus with the results for the East-wind direction case. By comparison with laboratory values, it can be verified that the hydrodynamics, the contaminant distribution, and the structure of the lake were correctly captured. In fact, the error values encountered when contrasting measured data and simulation is less than 10%. This shows that the model qualitatively captures the state of the lake.
The model introduced in this paper provides qualitative scenarios for the distribution of contaminants in the lake due to possible contingencies and becomes a tool for environmental evaluation and risk management under several wind directions and lake-characteristic conditions. Moreover, it provides (for each case) the critical places of accumulation of pollutants. This information enables the adequate position of mechanisms to collect data and the appropriate ponderation of each modeled term to design mitigation strategies for the pernicious effects of the contaminant.


 uBio
uBio 


