1. INTRODUCTION
Recycling of industrial waste is not only a need to maintain and protect the environment. The waste recycling process goes beyond adding value, also including the possibility of reducing the activities of exploitation of raw materials at the risk of scarcity and, very importantly, avoiding environmental devastation.
Blast furnace slag is a byproduct of iron and steel production. Its physicochemical characteristics are influenced by the type of production process used. Depending on the iron and steel production processes and the raw materials, the chemical composition and solidification structure of the blast slag can vary. Blast slag can solidify into four different structures: crystallized, granulated, pelletized and expanded. The crystalized slag, object of this study, is obtained by slow cooling of the liquid slag, that solidifies basically on silicates, aluminosilicates and calcium-alumina-silicates1, with high calcium concentration.
Even if the blast furnace slag is classified as a residue, its application as a raw material is evident in several industrial sectors. Increasingly, it has been drawing the attention of the researchers for the development of new applications and it is being considered as an environmental-friendly material2. Some applications of the slag in the industrial sectors are as complex fertilizer1, glass-ceramic foams using waste slag and glass as raw materials3, hydrothermal synthesis of zeolite4 and adsorbent materials5-8.
In this work, the samples of blast furnace slag, obtained from Aceros del Paraguay S.A. - Acepar, where the steel was processed by thermal treatment at different temperatures. This intends to determine if it is possible to utilize blast slag in an application of industrial level. The samples treated were characterized by X-ray diffraction (XRD), infrared spectrometry (FTIR) and scanning electronic microscopic (SEM/EDS). Based on the results, it was possible to predict the crystallized structure of the slag at different calcination temperatures, and the phases formed at each temperature. In addition, it was possible to confirm that this slag is adequate to be applied as heavy metal adsorbent and in vitroceramics production.
2. MATERIAL AND METHODS
The slag samples were collected from Acepar Company S.A., Paraguay, where steel production involves a coal-fueled blast furnace. Samples consists of slag discarded by the company. These samples were crushed with an agate mortar.
Then, samples were divided into four parts; three for thermal treatments at 860, 960 and 1060 °C, respectively, for 1 hour, with a heating rate of 10 °C/min, and the fourth part was preserved without any treatment (NC) as blank sample. The four samples were analyzed, in order to verify the changes and for quantification of the crystalline phases at the different temperatures. In addition, it was performed the evaluation of the chemical composition of each product obtained.
X-ray diffraction patterns of the samples were collected using a X’pert3 Powder, (Malvern Panalytical, Netherlands) with a CuKα radiation, generated at 45 kV and 40 mA, with CuKα source, 2θ range of 10 to 90°, the step size was 0.01° and step time of 0.5 s. Samples identification was made by comparing diffraction pattern with the ICDD (International Center for Diffraction Data) data bank.
Peak values of maximum intensities of each phase were used to determine their relative fractions. These values were calculated by the Eq. (a), which is the Relative Intensity Ratio (RIR) equation, presented below:
where, I phase 1 is the maximum intensity of the phase considered and 𝐼 𝑝ℎ𝑎𝑠𝑒 1..𝑛 is the summation of the maximum intensities of all the phases identified in the sample which was being analyzed.
Fourier transform middle-infrared spectra of the samples in KBr pellets were recorded in the range 4000-400 cm-1 using a Thermo Scientific Nicolet iS5 vacuum spectrometer comprising an ATR accessory and an air-cooled DTGS detector (Thermo Fisher, USA). The spectra were recorded at a resolution of 4 cm-1 with 128 scans. This method was used to identify the vibrational bands of functional groups.
Scan electronic microscopy with electron dispersive spectroscopy detector, (EVO-15, Zeiss, German) was used to study the surface morphologies of the samples, and their chemical composition. For the analysis, all the samples were coated in vacuum with a layer of 8 nm gold plasma, conductive coating, to completely eliminate the charge effect. The microscopic images were taken up with 1.00 and 5.00 kx of magnitude, high vacuum with 15kV.
3. RESULTS AND DISCUSSION
The chemical compositions of heat-treated and blank slag samples are presented in Table 1. All the samples showed high content of calcium and silicon. The amount of calcium increases along with the temperature rise, and the concentration of other elements decreases with it. The slag with the highest calcium content (40.46% in mass) reported in the literature is employed for lead (II) adsorption (9. In this case, the high calcium content favors the process of capture of heavy metals, since these tend to replace calcium in the crystal structure of the adsorbent10.
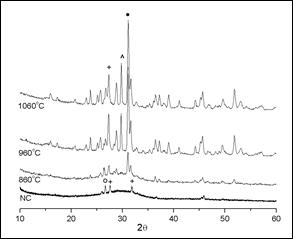
Figure 1 shows the results of the XRD analysis of the starting slag (NC) and those from the thermally treated samples at 860, 960 and 1060 °C. The starting slag used for the processing of the samples is a crystallized slag, cooled to reach room temperature. This sample is amorphous with some crystalline phases, perhaps due to its cooling process. It can be observed in the XRD patterns of the heat-treated sample at 860 °C a small amorphous halo, which indicates that it still contains an amorphous phase, although its crystallinity is already more noticeable. In the samples processed at 960 and 1060 °C the amorphous halo is no longer observed and these samples are practically crystalline.
Table 1 Chemical composition of the blast furnace slag samples from Acepar, Paraguay, at different temperatures
| Oxides (% wt) | Calcination temperature (°C) | |||
|---|---|---|---|---|
| Natural | 860 | 960 | 1060 | |
| CaO | 56.760 | 62.478 | 62.514 | 63.136 |
| SiO2 | 24.989 | 19.630 | 19.410 | 19.943 |
| Al2O3 | 6.644 | 8.668 | 8.331 | 6.871 |
| K2O | 5.462 | 4.325 | 4.371 | 3.943 |
| MnO | 0.356 | 1.837 | 1.829 | 1.829 |
| FeO | 3.237 | 1.602 | 1.734 | 2.301 |
| BaO | 1.476 | - | 0.679 | 0.930 |
| TiO2 | 0.604 | 0.791 | 0.529 | 0.443 |
| SO3 | 0.307 | 0.395 | 0.372 | 0.354 |
| Sr | 0.142 | 0.182 | 0.182 | 0.197 |
| Ag | -- | 0.047 | -- | -- |
| Zr | -- | 0.033 | 0.034 | 0.036 |
| Y | 0.016 | 0.010 | 0.011 | 0.012 |
| *L.O.I | 0.274 | 0.231 | 0.250 |
*Loss on ignition.

Figure 1 X-ray diffraction pattern for the blast furnace slag at different temperatures. (o) Quartz; (+) calcium silicate; (^) iron oxide; (() calcium aluminum silicate.
The XRD spectrum of the sample thermally treated at 860 °C, shows a greater intensity of the peaks of the phases when compared to those present in the NC sample and the beginning of the formation of the calcium aluminum silicate phase, around 29.736 (2(). The peaks of the phases observed in the NC sample intensify as the temperature of the heat treatment is increased, and the crystallinity increases too, as observed in the spectra of the samples at 960 and 1060 °C. It is also likely to observe the loss of the peak that identifies the presence of quartz, the increment of calcium silicate phase and the appearance of a third phase corresponding to iron oxide. According to the chemical composition of the starting slag, it can be expected during the crystallization, the formation of the mineral groups pseudowollastonite (01-074-0874 - Ca3(Si3O9)), magnatite (01-089-0951 - Fe3O4) and gehlenite (01- 079-1726 - Al2Ca2O7Si)1,11, being the last one the predominant phase. Due to the great difficulty to identify the mineral phases, and the similarity in the patterns, with the eventual overlap or proximity of high intensity peaks, it is possible that leucite phase (01-085-1419 - K(AlSi2O6)) would be present.
The relative amount of each phase in the sample treated at 1060 °C was calculated by Eq. (a). From the XRD results, it can be verified that relative amounts of the principal phases are as follows: gehlenite (calcium aluminum silicate) 51.00%; magnetite (iron oxide) 25.00%; and pseudowollastonite (calcium silicate) 17.94%, this phase could also be considered as leucite (potassium aluminum silicate 01-085-1419), since both peaks have their maximum intensities very close.
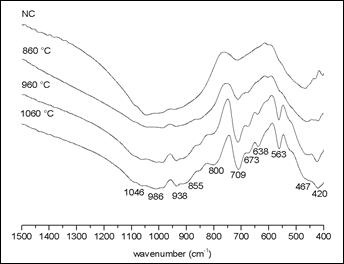
Mihailova et al.9 reported the formation of the merwinite phase containing magnesium, since the starting slag exhibited the presence of this element, indicated by the band around 617 cm-1. Our FTIR data did not show such band, which corroborates the results of EDS analysis, for the composition of our starting slag. All bands identified in the spectrum of figure 2 are in concordance with the XRD results shown in Figure 1.
Figure 2 shows the FTIR spectra of the samples thermally treated at different temperatures. The NC sample presents little shoulders, which are related to the gehlenite minerals and calcium silicates. The sample treated at 860 °C presents a weak increase in the intensity of the band around 709 cm-1, that can be related to the Si of the calcium silicate. The samples treated at 960 ºC and 1060 °C show progressive increase of the bands related to calcium silicate and gehlenite.
The sample treated al 960 °C shows a higher intensity of the 713 cm-1 band that corresponds to the symmetric vibrational of SiO4 group, related to melilite groups; it can correspond to gehlenite mineral. Regarding the bands around to 800, 564, 859 and 646 cm-1, the first two bands correspond to gehlenite and the last two correspond to larnite mineral, respectively. Furthermore, gehlenite bands occur at 851, 803 and 685 cm-1, and a comparative analysis between spectra, let us possible to consider them as weak shoulder bands. The band around at 850 cm-1 represents a stretching of Si-O bond from the tetrahedral silicate. The absorptions at 850-800 cm-1 appear in the characteristic frequency range of the interconnected AlO4 polyhedral and due to the stretching vibrations of the Al-O-Al bonds. The band at ~680 cm-1 probably corresponds to a vibration stretching that primarily involves the movement of the Al with tetrahedral coordination.
In the sample treated at 1060 °C, the band around 715 cm-1 presents a higher intensity than those observed in the other samples. The shoulders of bands at 800 and 850 cm-1 increased weakly their intensity, and those bands representing the mineral gehlenite appear with greater intensity. It was also observed the occurrence of a new small band at 1030 cm-1, corresponding to gehlenite, and the disappearance of the band at 475 cm-1 band corresponding to quartz.
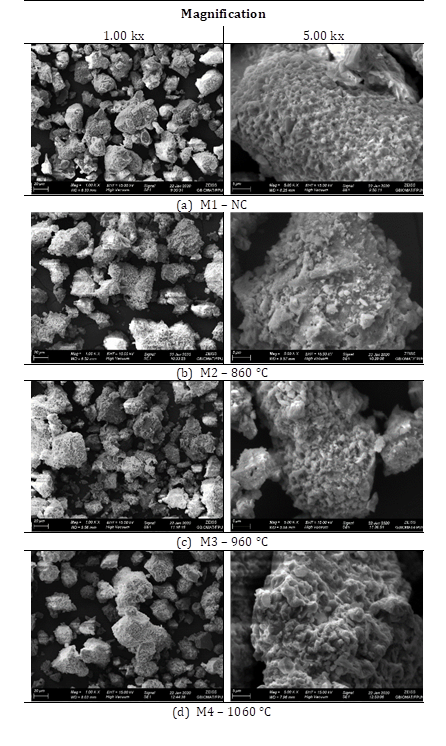
Microstructures of treated and untreated samples, revealed by scan electronic microscopy (SEM) are shown in Figure 3. It is possible to visualize morphology changes in the particles and their surfaces, depending on the thermal treatment applied. In Figure 3(a), it can be observed that the untreated samples present a quite rough and microporous surface, typically observed in this kind of slag9, when compared to treated samples. Besides this, can be observed that as the temperature of thermal treatment increases, microporosity reduces, which might be directly related to the granule coalescence process, resulting in more compacted particles. Although sample M2, Figure 3(b), presents particulate material on its surface, and is still possible to appreciate that it has a smoother and less rough surface, which might be associated to the beginning of formation of a new crystallographic phase, calcium aluminum silicate, Figure 1. Along with the temperature increase, this phase also increases considerably, resulting in samples M3 and M4, Figure 3(c) and (d), calcinated at 960 °C and 1060 °C, respectively, exhibiting both of them a smooth and rounded surface, being almost free of microporosities.
4. CONCLUSIONS
The results obtained from the characterization of blast furnace slag treated at different temperatures show that the samples have high content of calcium. The samples treated at 960 and 1060 °C exhibited mainly calcium aluminum silicate and gehlenite mineral, which favors the application of slag as heavy metal adsorbent and vitroceramic production. These results encourage us to continue our research work directed to explore the subsequent application of the slag as raw material in environmentally friendly applications.


 uBio
uBio 


