


 Espanhol (pdf)
 Artigo em XML
 Referências do artigo
 Enviar este artigo por email
 Citado por SciELO
  Similares em
SciELO
Similares em
SciELO  uBio
uBio 
 Permalink
1. INTRODUCTION
Obesity involves genetic, environmental and lifestyle aspects that lead to a cardio-metabolic disorder. The World Health Organisation (WHO) defines obesity as a chronic disease characterised by an increase in body fat of multifactorial aetiology and associated with greater health risk, according to its magnitude and topographic location. Another feature of obesity is a positive energy balance, which occurs when the ingestion of calories exceeds energy expenditure, causing an increase in body fat deposits and therefore weight gain1,2.
Overweight and obesity are one of the main challenges for the primary health-care system and public health. Only a few countries, such as Finland, have been able to achieve regression of the obesity epidemic3,4. In Paraguay, in 2010, 54% of the overweight and obese population also had hypertension. The prevalence of hypertension in the overall population was 39%. Furthermore, it was 1.5 to 3% higher among those with diabetes5.
Diagnostic techniques for imaging of adiposity are the most efficient methods to diagnose obesity. However, these techniques present limitations for epidemiological studies due to the high cost and logistic difficulties in their application6. Therefore, widely used methods to evaluate the percentage of body fat and abdominal obesity include body mass index (BMI)7 and waist circumference (WC)8,9. WC is a biometric measure that is used to determine centripetal obesity by measuring the accumulation of abdominal fat10-12.
Epidemiological studies have described an increase in the incidence of certain chronic non-communicable diseases with the increase in BMI, especially type 2 diabetes and cardiovascular disease (CVD)11. However, from a clinical point of view, certain paradoxes exist. It is known, for example, that some patients may present a metabolic profile of normal risk, despite showing an excess of body fat, whereas others, with a moderate excess of weight, already present some metabolic complications10,13,14. Vague et al.14 observed already in 1947 that people with abdominal obesity developed cardiometabolic pathologies more frequently, compared with those who had peripheral obesity10,15,16. Similarly, Crepaldi et al were one of the first to report the simultaneous presence of central obesity, hyperinsulinaemia, hypertriglyceridemia and hypertension17.
The joint determination of WC and BMI better predicts the risk of cardiometabolic diseases when compared with BMI alone18,19,20. However, it has been shown that increased hip circumference decreases the risk for metabolic health. While WC is positively associated with an increased health risk, the hip and thigh circumference are inversely associated with this risk21,22. This implies a protective effect linked to large hip circumference or thigh circumference (or both), which could be due to greater lean mass in the non-abdominal regions23.
Thus, the objective of the present study was to evaluate the correlation between BMI and WC with hypertension and fasting glucose in residents of a rural population in Paraguay between 2012-2013.
2. MATERIALS AND METHODS
2.1. Study design and Population
This cross-sectional study was conducted in Norma Luisa Fraction, a rural population close to the city of Minga Guazú, Alto Paraná Department in Paraguay. Minga Guazú is a city in the east of Paraguay with a total population of around 60.7195.
The study population consisted of 280 participants between September 2012 and May 2013. The inclusion criteria were aged 18 to 64 years-old who lived in the Norma Luisa Fraction and were not institutionalised. People who did not have full enjoyment of their faculties or who suffered from an illness that prevented them from responding to the questionnaire were excluded from the study.
2.2. Instruments
Determination of the energy balance
Weight measurement was performed using a balance (Toledo® model 2096PP/2 10399512 series) with a maximum capacity of 200 kg and a precision of 0.05 kg, chosen for its accuracy and ease of use. The participants were measured without shoes wearing light clothing. Each respondent was asked to stand on the scale, with feet 15 cm apart from each other, facing forward. The information was recorded in kilograms with two decimals.
Height was determined using the balance's stadiometer, which had a measurement range of 150 to 201 cm (with 0.5 cm of precision). The measurement was made with the participant without shoes,
EBMI was calculated according by dividing the weight in kg of each person by the square of their height in metres (kg/m2) [24]. The BMI categorisation used was that proposed by the WHO2:
BMI < 18.5 = Underweight
BMI 18.5 - 24.9 = Normal weight
BMI 25.0 - 29.9 = Overweight
BMI 30.0 - 34.9 = Obesity (class 1)
BMI 35.0 - 39.9 = Obesity (class 2)
BMI > 40.0 = Obesity (class 3)
According to the criteria of the International Diabetes Federation (IDF) of 2005, later revised in 2009, abdominal obesity was defined as a WC ≥ 80 cm in women and ≥ 94 cm in men25.
Biochemical measurement
Blood glucose were measured after fasting. The samples were processed on the same day they were obtained in the laboratory of the Medical Research Centre (Centro de Investigaciones Médicas) of the School of Health Sciences of the National University of the East (Universidad Nacional del Este), an institution certified by the Department of Health Surveillance of the Ministry of Public Health and Social Welfare (Ministerio de Salud Pública y Bienestar Social - MSPyBS).
The cut-off points applied for glycaemia were those recommended by the National Cholesterol Education Programme (NCEP) and the Adult Treatment Panel III (ATPIII)26.
Measurement of blood pressure
Trained evaluators measured arterial pressure in the left arm of each subject after resting for 5 minutes with the back supported and the arm held at heart level. Two measurements were taken, separated by a recommended time interval of 3 minutes, with OMRON 781 electronic tensiometers. In the case of diabetic patients or patients taking antihypertensive medications, the occurrence of postural changes was verified, with readings taken immediately and 2 minutes after the patient stood up. The classification of blood pressure levels used was that proposed by the seventh Joint National Committee on Prevention, Detection, Evaluation, and Treatment of High Blood Pressure.
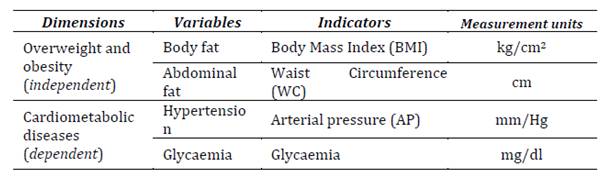
Variables of interest
Statistical analysis
The loading, editing and analysis of data were conducted using Excel® electronic spreadsheets. Descriptive analyses (indicators of relative frequencies and summary measures), correlation analyses (Pearson coefficient and Spearman's Rho) and comparisons between groups (Kruskal-Wallis) were conducted, assuming a confidence level of 99%.
Ethical considerations
This study followed the standards of good clinical practice of the Declaration of Helsinki and was developed in accordance with current Paraguayan regulations: Resolution No. 146 of March 8, 2012, Ministry of Public Health and Social Welfare (Ministerio de Salud Pública y Bienestar Social - MSPyBS)27, which classifies this type of study in the category of risk-free research as described in the informed consent signed by each participant.
3. RESULTS
The recruitment period was from January to June 2012, and the data were collected from September 2012 to May 2013. Of the total number of invited persons (n = 345) between 18 to 64 years of age of the Norma Luisa Fraction of the San Roque González de Santacruz neighbourhood, in the city of Minga Guazú, the response rate was 81% (n = 280), of whom 28% (n = 77) were males and 72% (n = 203) were females.
The highest frequency of participants according to age and sex was 18.9%, which was recorded in the age range of 42 to 47 years.
Statistically significant differences were observed in the systolic and diastolic blood pressure and glycaemia values in the four categories of BMI and WC.
The most significant difference in arterial pressure was that between the medians of normal BMI and those in the overweight and obesity groups.
With respect to fasting glucose, a significant difference was observed between the groups with normal BMI and those with obesity (Table 2).
Table 2. Arterial pressure and glycaemia according to BMI.
| BMI Nutritional Status (n = 280) | p | ||||
|---|---|---|---|---|---|
| Undernourished | Normal | Overweight | Obesity | ||
| Median | Median | Median | Median | ||
| Diastolic Arterial Pressure | 67.00 | 74.50 | 84.00 | 89.00 | < 0.01* |
| Systolic Arterial Pressure | 95.00 | 112.00 | 130.50 | 132.00 | < 0.01* |
| Fasting glucose | 73 | 78 | 80 | 83 | < 0.01* |
Significant differences were observed in the medians of the systolic and diastolic arterial pressure and glycaemia values according to the different categories of WC (Table 3).
Table 3: Arterial pressure and glycaemia according to WC.
| Waist circumference (n = 280) | p | |||
|---|---|---|---|---|
| Low | Moderate | High | ||
| Median | Median | Median | ||
| Diastolic Arterial Pressure | 75.00 | 86.00 | 88.00 | < 0.01* |
| Systolic Arterial Pressure | 113.00 | 127.00 | 132.00 | < 0.01* |
| Glycaemia | 78 | 81 | 83 | < 0.0 |
The most significant difference between the medians of arterial pressure was between the categories of low WC and those of moderate WC and high WC.
Regarding glycaemia, a significant difference was observed between the medians of the group with low WC and that of the group with high WC.
There was a strong correlation between both biometric indicators (BMI and WC), with a confidence level of 0.99. On the other hand, the correlations that occurred between the biometric indicators, according to each cardio-metabolic variable (blood pressure and fasting glucose) were also statistically significant, with the correlation between the biometric indicators and arterial pressure being greater than the correlation with glycaemia (Table 4).
Table 4: Correlation between arterial pressure and glycaemia with BMI and WC biometric indicators.
| Correlation coefficient | p | |||
|---|---|---|---|---|
| Pearson correlation | WC | BMI | 0.848** | < 0.01 |
| Spearman’s Rho | BMI | Diastolic Arterial Pressure | 0.397** | < 0.01 |
| Systolic Arterial Pressure | 0.397** | < 0.01 | ||
| Glycaemia | 0.214** | < 0.01 | ||
| WC | Diastolic Arterial Pressure | 0.420** | < 0.01 | |
| Systolic Arterial Pressure | 0.429** | < 0.01 | ||
| Glycaemia | 0.306** | < 0.01 | ||
| **The correlation was considered significant at the 0.01 level (2-tailed). | ||||
4. DISCUSSION
Our study found that there was a significant correlation between BMI and WC with higher arterial pressure and glycaemia levels in the population studied. Furthermore, there was a significant correlation between the BMI and WC indices in this population.
Our study had a high response rate, since 81% of the people from the community who were invited responded. Women had a greater participation rate, which was possibly due to the matriarchal culture where the woman is the one who represents the families in most gatherings [28-34]. According to age, the modal class was between 42 and 47 years. Similar results with respect to the sex with greater participation can be seen in the studies of Brännström et al.28, Calandrelli et al.31, Ng et al.35, Moura et al.30. A similar result in terms of age and sex ranges can be seen in the study of Choo et al.28-31,35,36.
The BMI and WC indicators are commonly used as indicators of health status, as stated by several epidemiological and clinical studies37,38 whose results coincide with those obtained in this study conducted in Norma Luisa, which shows a strong positive correlation between both parameters.
The results obtained in this study on the correlation between systolic and diastolic blood pressure and fasting glucose with the BMI and WC indicators were significant. These findings are similar to those reported in the study by Yon37 in Cambodia and the review performed by Rosales20, especially for predicting the risk of cardiovascular diseases, hypertension, type 2 diabetes and dyslipidaemia. The study by Ford et al.39 supports the use of the WC to predict trends in health risk, such as the review performed by Rosales20, who cited the study of Lean in 1995, on the validation of the WC as one of the most accepted indicators in health promotion programmes worldwide. Likewise, the meta-analysis of Vazquez et al.40 mentions that clinically, central obesity generates diabetogenic substances and is measured by the WC, so it is more informative than the BMI. This leads us to conclude that WC alone can be used to indicate metabolic risk factors, so that men and women with BMIs that do not exceed the range considered normal but who have a WC greater than the ranges considered normal are exposed to significant health risks20,40. This is the time when primary prevention actions should be initiated in these people to reduce the development of cardio-metabolic diseases25.
The importance of this study lies in its ability to categorise the study population into groups with healthy and unhealthy lifestyles, especially in middle- and low-income countries2 through the use of accessible low-cost indicators, with great predictive power from the epidemiological point of view.
5. CONCLUSIONS
The results obtained showed that BMI and the WC are predictors of hypertension and high glycaemia. The use of these estimators will help to establish predictions of morbidity and mortality, both for clinical purposes and in the design of community intervention programmes for changes of behaviour.

